
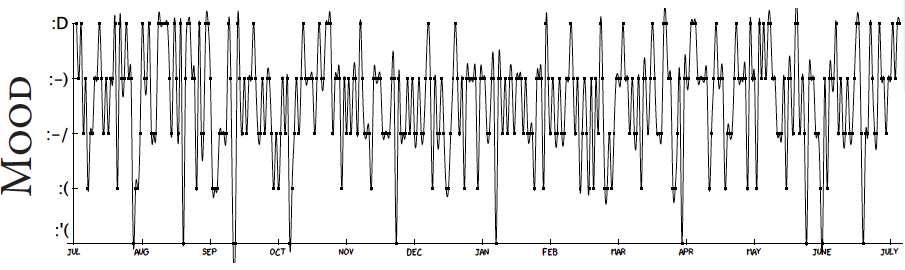
These statistics are pulled from data reported from the period 7/5/2013-7/5/2014.On 7^2 (7/7/14), Lily turned a multiple of 3. This is the 7th year Lillian has published personal statistics.
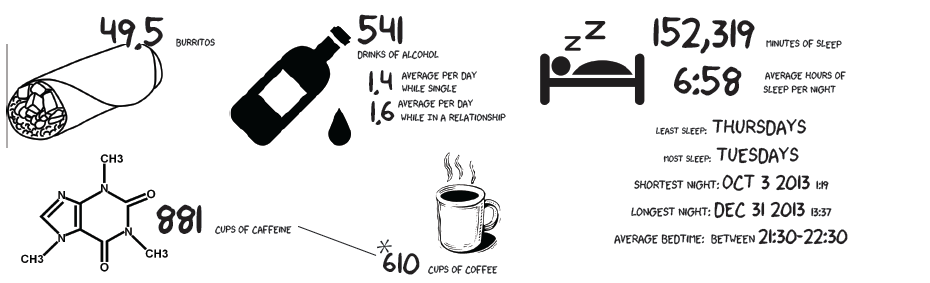
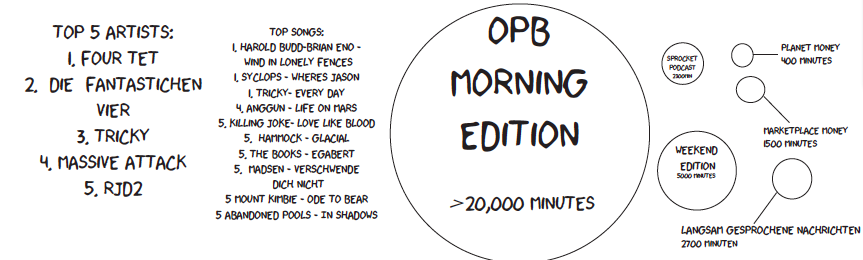
Data was collected using Lumen Trails Daily Tracker, Sleep Cycle, Moves, Runkeeper, Last.FM, handwritten journal entries, Twitter API, and Reporter app. Statistical & data work was done using R, Aaron Parecki’s iMessages PHP, Excel, Google Docs, and SQL. Data was visualized using OmniGraphSketcher, InDesign, Moves-O-Scope and LaTeX.
Consumed during production of this zine: 6 coffees, .5 coldbrew smoothie, 1 kombucha, 2 mimosas, 1 IPA. 1 falafel sandwich, .5 bag pretzels, 6 tacos, kale.
Data was massaged at the following locations: Canteen cafe, Independent Publishing Resource Center roof, Case/Parecki backyard shed, Laurelhurst Studios, and Casa de Lily & Kell.
One thought on “This Year in Numbers – 2014”
Comments are closed.
Mentions